When it comes to logging and monitoring, organizations nowadays are dealing with a colossal amount of data coming from various sources, including applications, servers, firewalls, VPNs, etc. These data are essential for doing a forensic analysis and finding use cases.
ClickHouse is highly regarded for its ability to process massive amounts of data in real-time, making it an ideal choice for logging use cases.
ClickHouse is a highly scalable, open-source database management system designed for OLAP. ClickHouse utilizes a columnar data structure and supports distributed query processing, partitioning, data replication, and sharding. This makes it an excellent choice for applications dealing with massive structured datasets, complex data reports, data science computations, and data analytics. These features make it an ideal candidate for a logging system, In this blog we will try to create a logging system based on clickhouse.
What is OLAP?
OLAP (for online analytical processing) is software for performing multidimensional analysis at high speeds on large volumes of data from a data warehouse. OLAP scenarios require real-time responses on top of large datasets for complex analytical queries with the following characteristics:
- Datasets can be massive - billions or trillions of rows
- Data is organized in tables that contain many columns
- Only a few columns are selected to answer any particular query
- Results must be returned in milliseconds or seconds
What is a Columnar database?
A columnar database is a database management system (DBMS) which stores data in columns rather than rows. The purpose of this storage method is to efficiently write and read data to and from hard disk storage, which leads to improved query performance and speed.
ClickHouse Quickstart
ClickHouse runs natively on Linux, FreeBSD, and macOS, and runs on Windows via the WSL. The simplest way to download ClickHouse locally is to run the following curl command. It determines if your operating system is supported, then downloads an appropriate ClickHouse binary:
Download the binary using the given command
curl https://clickhouse.com/ | shOnce downloaded Start the server using the command
./clickhouse serverthe Use the clickhouse-client to connect to your ClickHouse service. Open a new Terminal, change directories to where your clickhouse the binary is saved, and run the following command:
./clickhouse clientNow that we have successfully connected to the server, we can execute queries using this client
Let's define a simple table in ClickHouse to store our log entries. We'll create a table called logs with columns for the log message, timestamp, and any other relevant information.
CREATE TABLE logs
( timestamp DateTime, log String, level String )
ENGINE = MergeTree() ORDER BY (timestamp);
We just started a simple click-house server with a table for logs. Now let's ingest some real logs into it using its driver SDK's. Clickhouse supports ingestion via HTTP interface and you can ingest it using the fluent bit, logstash as well
Ingesting logs
Let's use a Python script for ingesting logs into clickhouse. We'll use the click house-driver library to send data into Clickhouse.
it can be installed using pip package manager
pip install click house-driver
Please use the given Python script to write logs into Clickhouse
import clickhouse_driver
from datetime import datetime

def log_to_clickhouse(message, level='DEBUG'):
  client = clickhouse_driver.Client('localhost')
  timestamp = datetime.now().strftime('%Y-%m-%d %H:%M:%S')
  query = f"INSERT INTO logs(timestamp, log, level) VALUES('{timestamp}', '{message}', '{level}');"
  client.execute(query)

log_to_clickhouse("System shutdown", level='ERROR')
log_to_clickhouse("Something went wrong", level='ERROR')
Copy the given code into a Python file and execute it to ingest logs into click house
python main.pyVisualizing via grafana
Let's use Grafana as a visualization layer for our sample logging system. Use the given docker-compose file to spin up a Grafana instance.
version: '3.8'
services:
  grafana:
    image: grafana/grafana-enterprise:latest
    container_name: grafana
    hostname: grafana
    environment:
    - GF_INSTALL_PLUGINS=grafana-clickhouse-datasource
    ports:
      - "127.0.0.1:3000:3000"
Copy the YAML file into docker-compose.yaml and execute it via the docker command
docker-compose up
Once the stack is up you can access Grafana UI in the given URL
http://localhost:3000
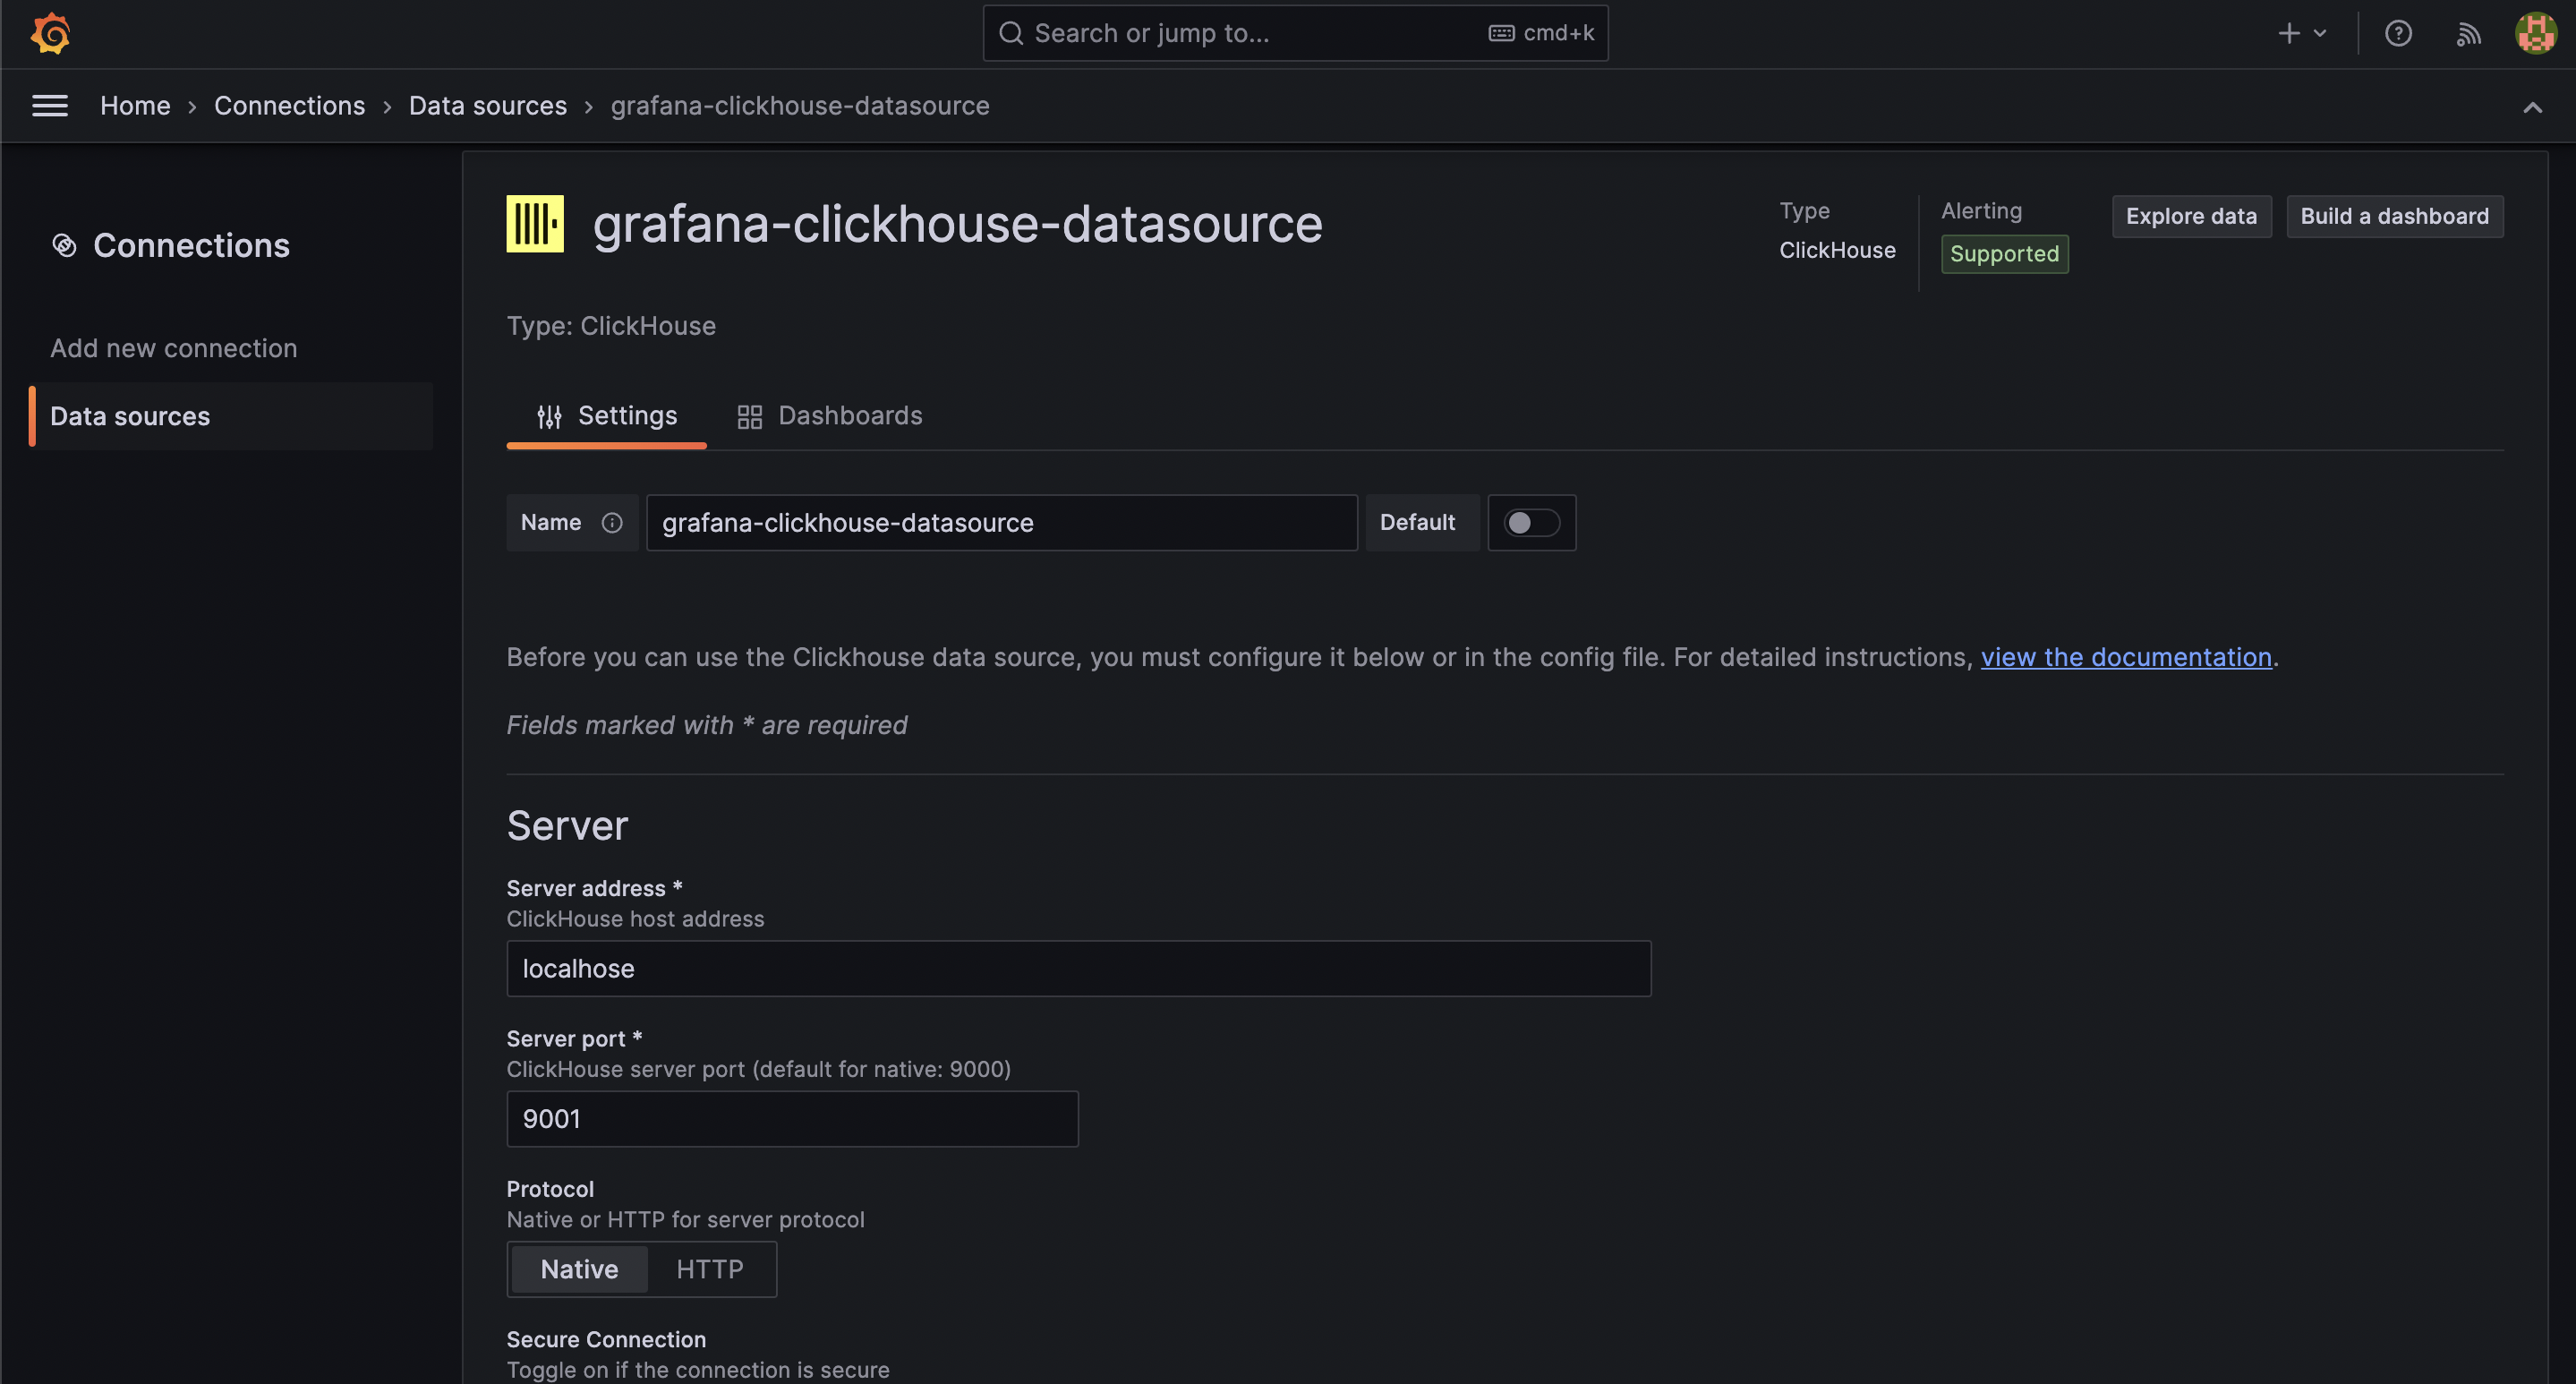
Now we can add the click house data source in Grafana in-order to visualize the data.
Go to connections and add Clickhouse as a data source
In the explorer section, you should be able to query from Clickhouse
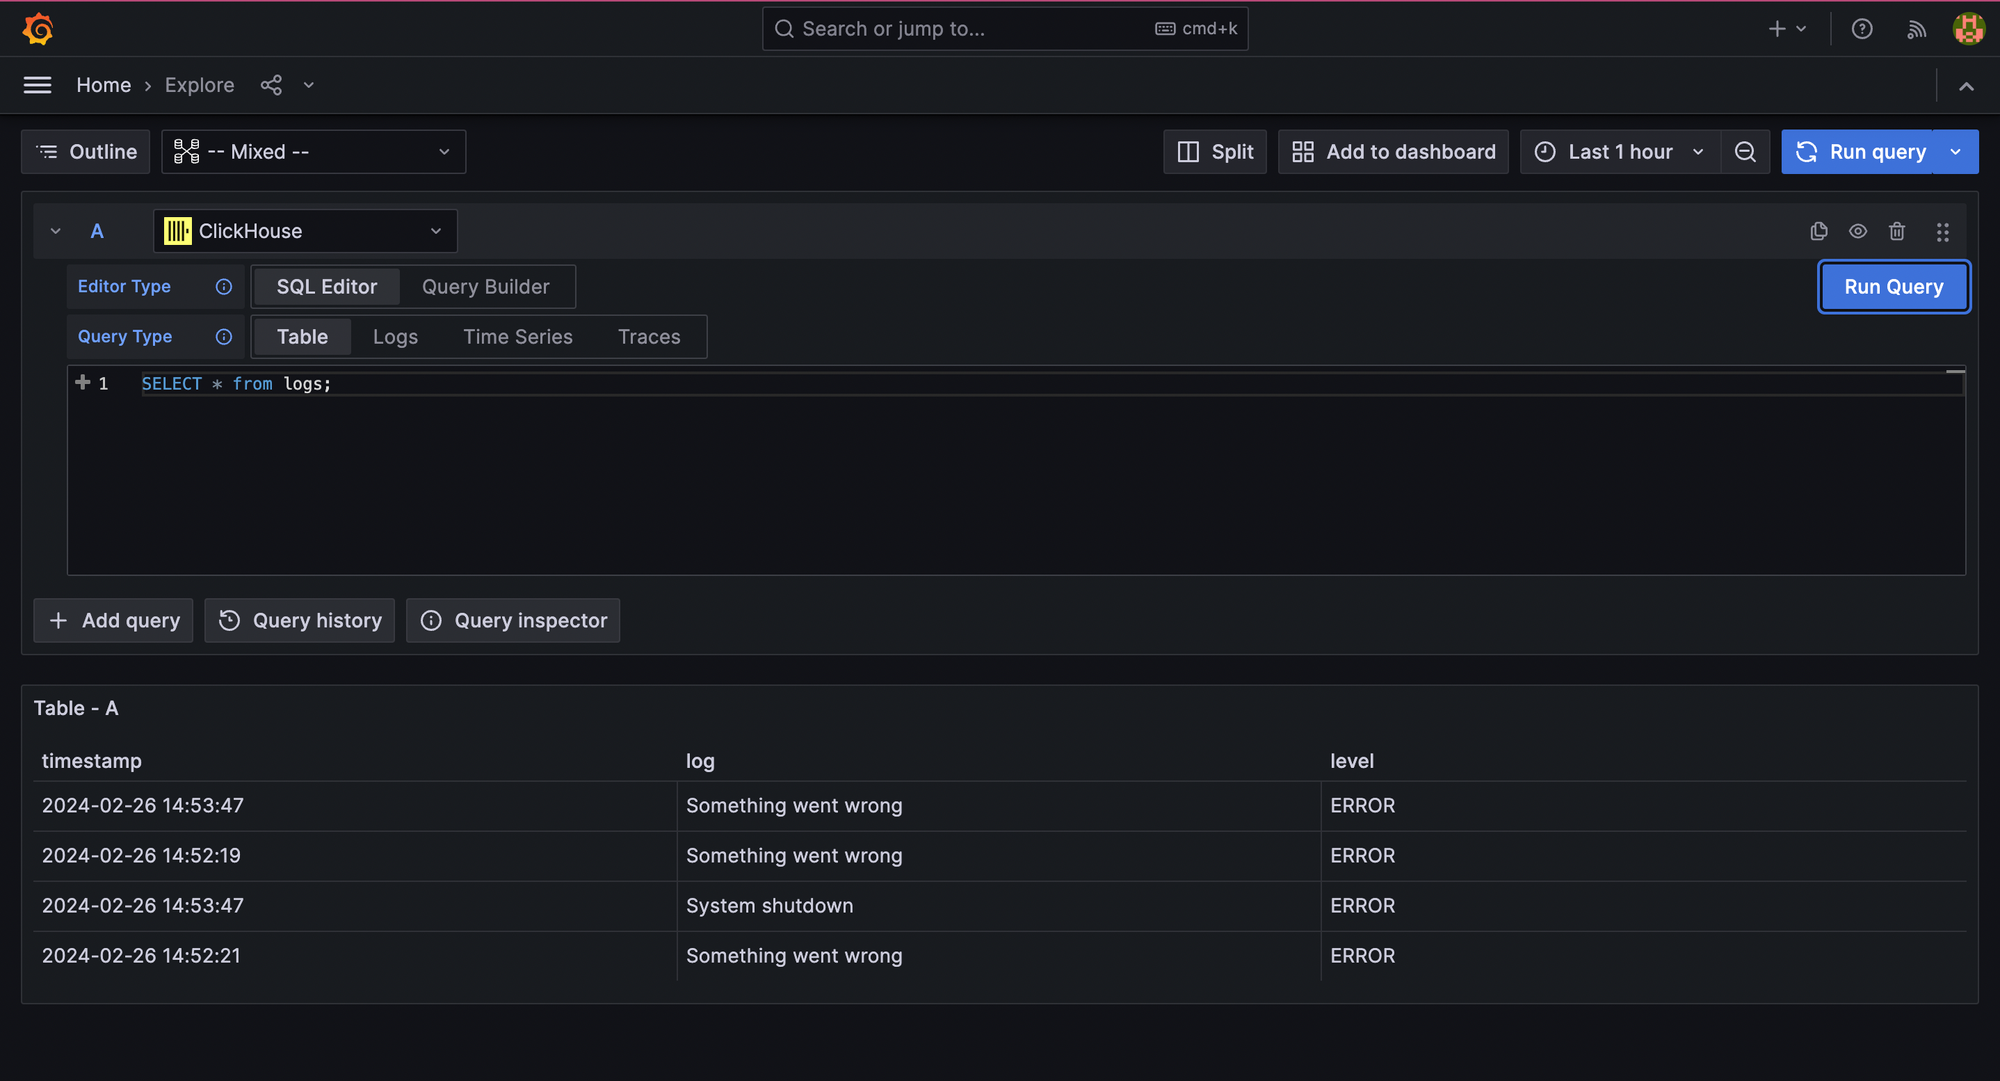
Just like that, you can execute queries in the Clikhouse on top of logs like we do in the traditional logging systems. As Clickhouse follows a SQL-like language it would be easier to write queries and slice & dice the logs.
So we built a simple logging system using Clickhouse. Logs are supposed to be immutable by nature and ClickHouse works best with immutable data. So from this blog, we can understand that Clickhouse can be used for logging. However various optimizations are required to convert it from a DB into a full full-fledged logging system.