Imagine you run a gaming platform where thousands of people are playing multiplayer games at once. Microservices are used by your platform to handle player authentication, game server administration, and matchmaking. You must keep an eye on the performance of your underlying infrastructure and microservices in real-time if you want to provide a flawless gaming experience. You can obtain insights into latency, server response times, and player activity by installing Grafana Agent on your Kubernetes clusters and integrating it with Grafana Cloud. This will enable you to optimise performance and provide your users with an amazing gaming experience.
In this guide, we'll walk through the process of setting up Kubernetes monitoring using Grafana Agent and Mimir in Grafana Cloud. With Grafana Cloud's reliable monitoring features, you can easily obtain insights into your microservices and Kubernetes clusters.
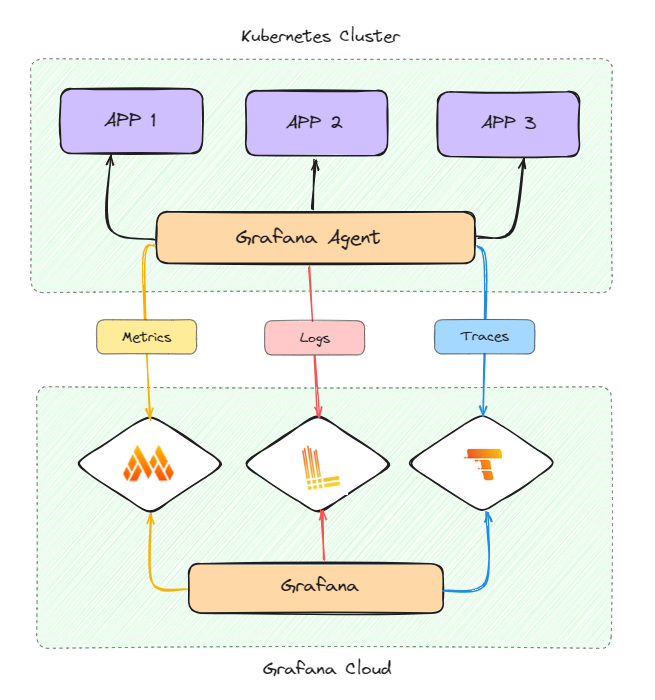
Architecture Overview:
Grafana Agent is used in the architecture to make it easier to gather logs, traces, and metrics from the Kubernetes clusters that host the microservices of the gaming platform. After receiving, these data are sent to Grafana Cloud, where they are processed and stored. Utilising its features—Grafana for visualisation and Mimir for metric storage—Grafana Cloud offers insights into player activity and system performance.

Components
Microservices : Microservices allow a large application to be separated into smaller independent parts, with each part having its own realm of responsibility.
Kubernetes : Kubernetes is an open-source system for automating deployment, scaling, and management of containerized applications. It groups containers that make up an application into logical units for easy management and discovery.
Grafana Agent : The Grafana Agent is a telemetry collector for sending metrics, logs, and trace data to the opinionated Grafana observability stack.
Grafana Mimir : Mimir is an open source, horizontally scalable, highly available, multi-tenant TSDB for long-term storage for Prometheus.
Grafana Cloud: Grafana Cloud is a fully managed observability platform that offers a number of tools for tracking and displaying logs, traces, and metrics.
Prerequisites:
- Set up Grafana Cloud:
- Visit Grafana Cloud at www.grafanacloud.in and create a stack/instance.
- Configure data source and cluster settings in Grafana Cloud.
- Deploy Microservice on Kubernetes:
- Use kubectl apply -f deployment.yaml to apply the deployment configuration file and deploy the microservice on Kubernetes.
Setting Up Kubernetes Monitoring with Grafana Agent & Mimir:
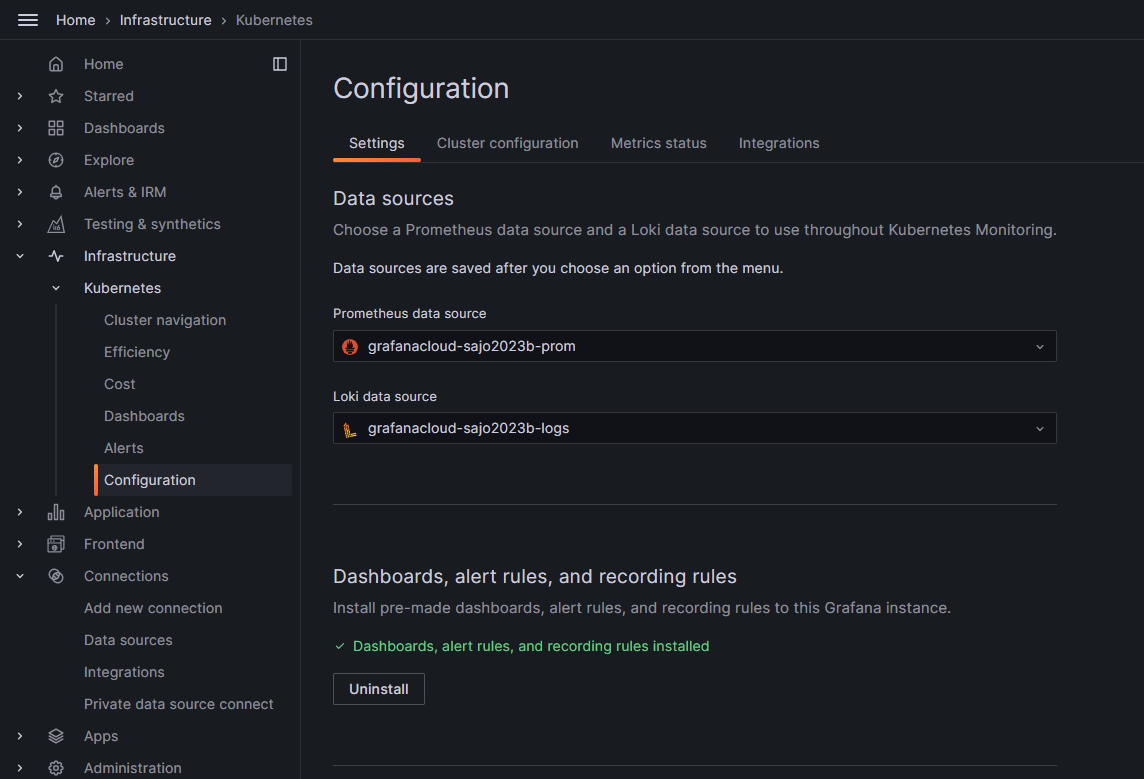
- Configure Data Source in Grafana Cloud:
- Navigate to Infrastructure > Kubernetes > Configuration > Settings in Grafana Cloud.
- Specify the data source for your Kubernetes cluster to enable Grafana to collect metrics.
- Install Dashboards and Alert Rules:
- In Grafana Cloud, click on "Install" to install pre-configured dashboards and alert rules for Kubernetes monitoring.
- Set Up Cluster Preferences:
- To give your Kubernetes cluster a name and namespace, navigate to Grafana Cloud's Cluster Configuration.
- Create an Access Token:
- To authenticate the Grafana Agent with your Grafana Cloud instance, generate an access token in Grafana Cloud.
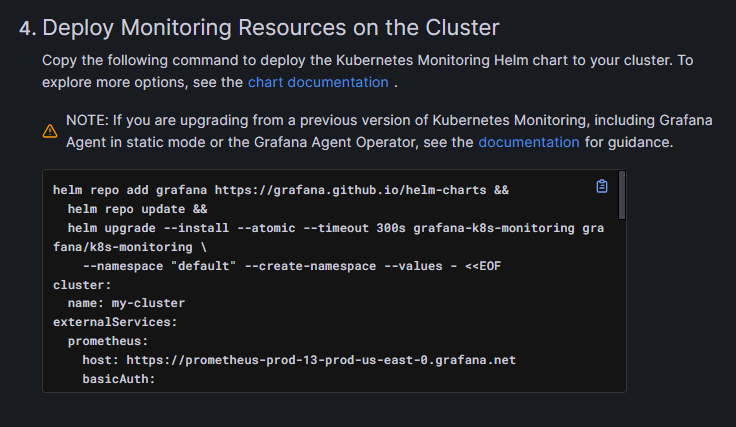
- Install Resources for Monitoring on the Cluster:
- Copy the command found in Grafana Cloud's "Deploy Monitoring Resources on the Cluster" section.
- To add Grafana Agent and other monitoring resources to your Kubernetes cluster, execute the copied command in your terminal.
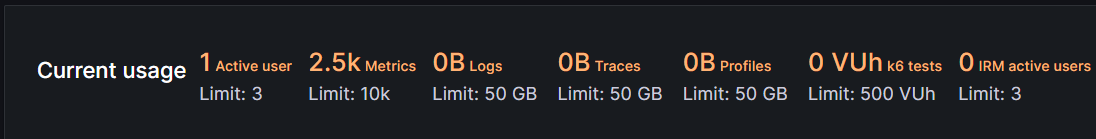
- Examine the Grafana Cloud Metrics:
- Return to Grafana Cloud by navigating after about 10 seconds.
- Verify whether Grafana Cloud has begun to display the metrics from your Kubernetes cluster.
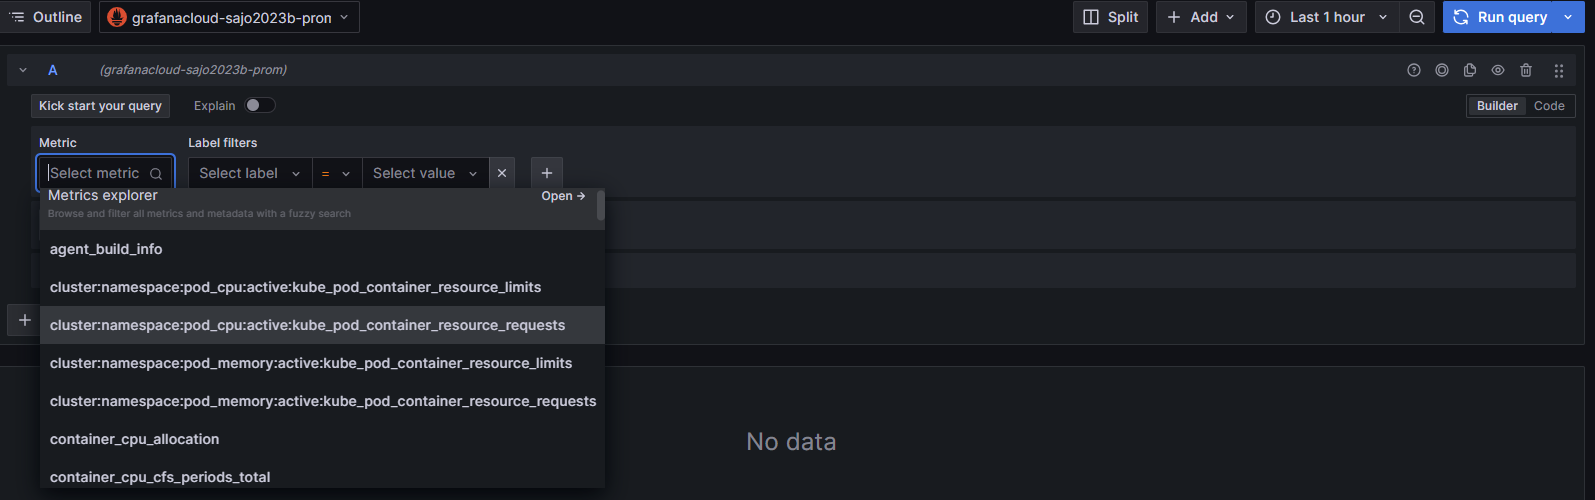
- Explore Metrics:
- Open Grafana Cloud, navigate to the "Explore" option, and choose the relevant data source.
- Examine individual metrics to learn more about the functionality and resource usage of your cluster.
Use the visualization tools in Grafana Cloud's "Dashboards" section to create customized dashboards based on metrics that have been gathered.
You have successfully configured Grafana Cloud's Kubernetes monitoring using Grafana Agent and Mimir by following this guide. You will have real-time insights into the functionality and health of your Kubernetes clusters and microservices thanks to this all-inclusive monitoring solution.
