
In the world of IT and handling incidents, there are two key metrics that really make a difference in how reliable our service is and how happy our customers are: Mean Time to Detect (MTTD) and Mean Time to Resolve (MTTR). To gain a deeper understanding of MTTD, check out the previous blog post on Factors Affecting MTTD.
These metrics play a crucial role in how quickly an organization can identify and address issues, thereby minimizing downtime and maintaining service quality. We could say “The lower, The best”
What is MTTR?
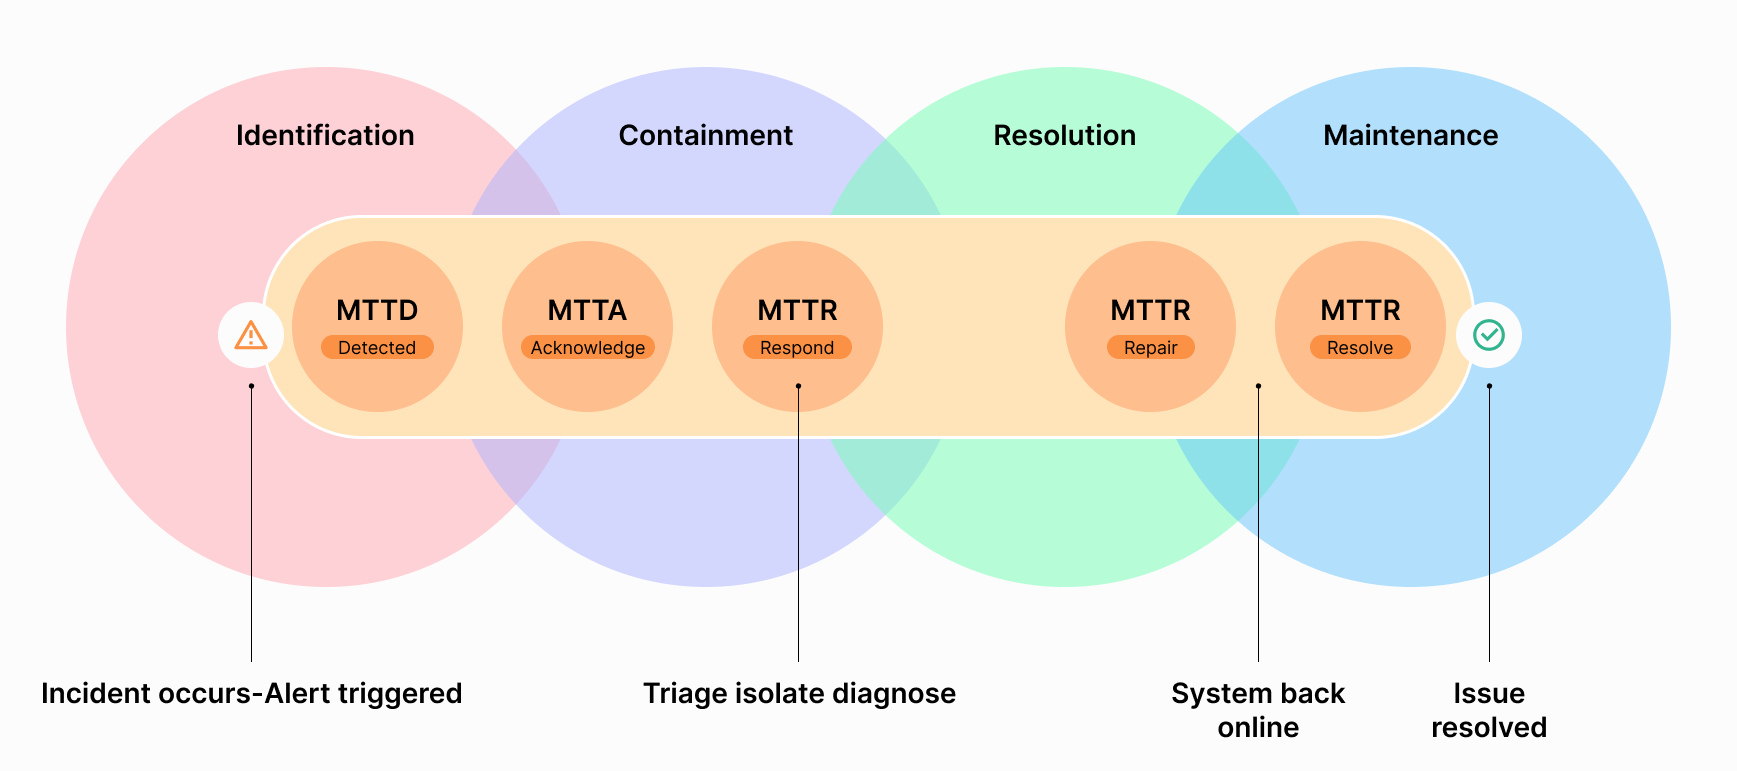
Mean Time to Resolve (MTTR) refers to the average time taken to resolve an issue after it has been detected. This includes time to fix the problem and complete any additional work needed to prevent the issue from recurring. This may include failure detection, diagnosis, restoration, and proactive steps taken to harden the system against similar failures in the future.
Let’s say we take the case of Meta in the last blog, They managed to recover from the disruptions within a short span of 2 hours. This period comprises the MTTR, highlighting their ability to quickly rectify issues once detected. Within a total of 4 hours from the initial detection of the problem, they had fully addressed the issue and marked it as resolved.
This case underscores the importance of both MTTD and MTTR in maintaining service quality and minimizing downtime. An efficient system for detecting and resolving issues, as demonstrated by Meta, can significantly enhance the reliability of a service and the satisfaction of its users.
How do we improve MTTD and MTTR?
Reducing the Mean Time to Detect (MTTD) and Mean Time to Repair (MTTR) is crucial, as it directly impacts customer satisfaction. Many organizations employ tools and methods to resolve issues faster, often before the customers are even aware of them. We have many ready-to-use APM and other tools that cover application monitoring in every aspect.
But increasing systems again increases complexity. When an issue occurs, data lies in various systems and when an issue occurs one would have to look into all of these and it’s again time and effort.
Let’s see the Onepane approach to Reduce these,
- Automated discovery: OnePane's automated discovery identifies the relationships between components across platforms, and displays them on the OnePane service map. This function operates across various systems such as cloud and APM tools.
- Automated Change Tracking: Once the system is connected to your environment, it automatically tracks all the changes and incidents happening within and stores them for analysis. The Onepane core system has the ability to measure the impact of every event.
- Capture data from Monitoring systems: OnePane can capture incidents and other events from your monitoring systems and correlate them to the corresponding resources in the cloud environment.
- Automated Correlation: The Onepane correlation engine can correlate resources across the environments. The first two steps clean and enrich all the resources, and the correlation engine will do a neat job in correlation.
- Automated RCA: OnePane analyzes your service health, incidents, changes, and observability data to swiftly identify the root cause of ongoing incidents. It reduces incident noise, unifies events, and offers root cause analysis with suggested solutions.
Let’s take a sample scenario to see what Onepane does
Application A is deployed in Azure AKS with log analytics enabled. Application A code base is in GitHub and Uses Azure DevOps for CICD. Application A is monitored using Newrelic. Consider A critical update done last weekend is causing an outage on Monday
What will you have to do in a normal scenario?
- Get alert and resource details from Newrelic
- Get related logs and events from Newrelic
- Get alert details from Azure
- Find the corresponding resource in Azure
- Find related logs and events from Azure
- Find related CICD pipeline details
- See what changed in the source repo
- Summing all this information to find the Cause
- Check Internet/ChatGPT for solutions]
With Onepane it's straightforward. As we have all these systems connected and correlated, With Onepane you won't have to do all of these.
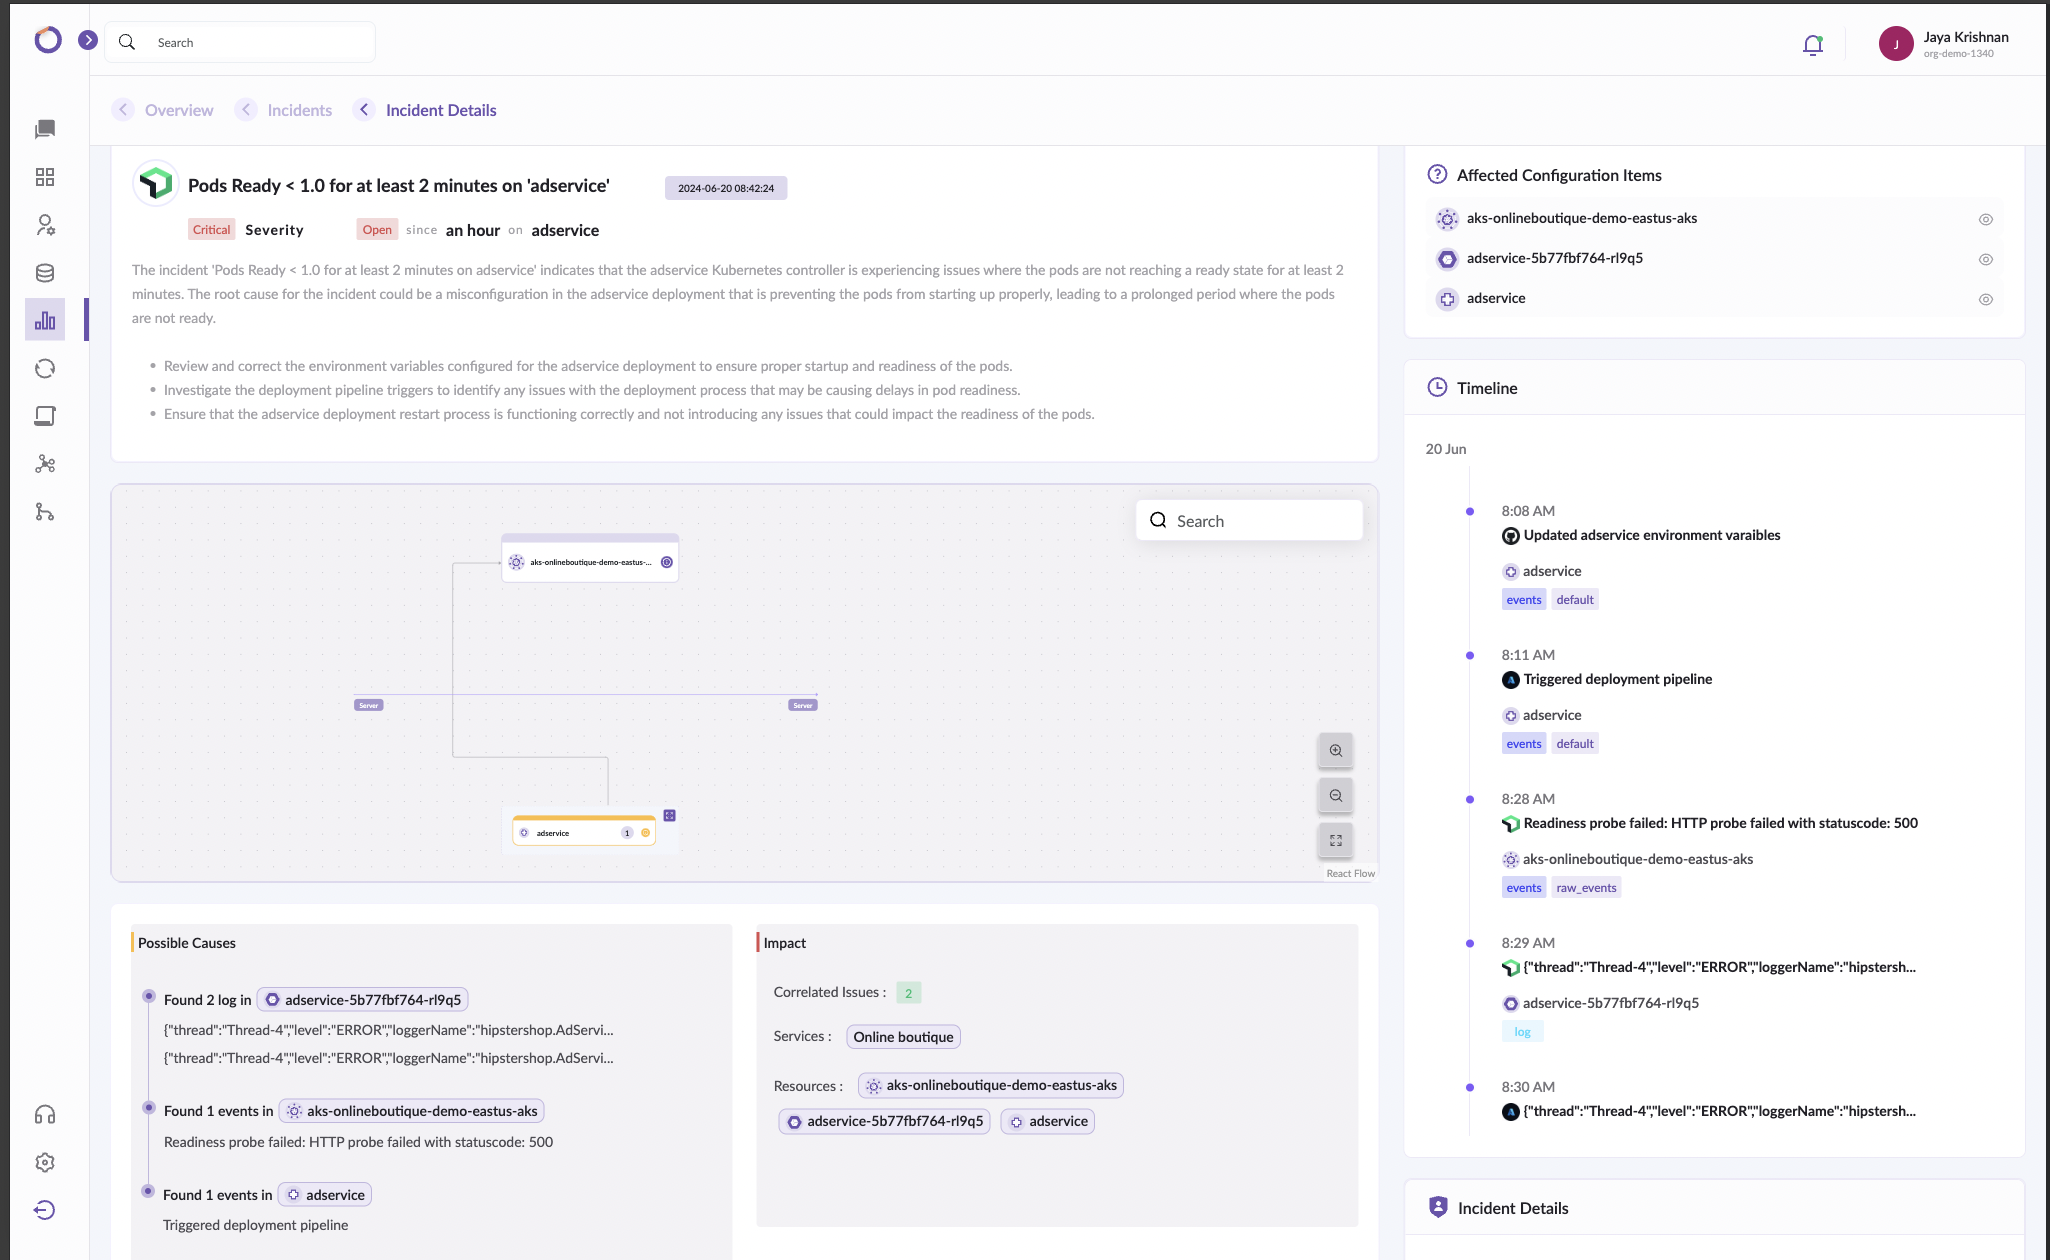
You will get a detailed description of your incident with possible causes and fixes along with a Service Map and a timeline that is filtered based on impact and should contain all the events from all connected systems. As an add-on, you will get suggested solutions filtered for your incident.
As an integrated platform, Onepane can consolidate data across various systems. This feature not only brings together all the essential information in one place but also helps in identifying possible root causes of any issues that might arise. This comprehensive approach significantly enhances the efficiency of any incident management system.
Moreover, by offering a streamlined solution, Onepane saves a considerable amount of time, allowing teams to focus on resolving incidents rather than getting bogged down in data collection and analysis by helping to detect and pinpoint problems faster, Onepane effectively reduces MTTD. Simultaneously, by providing potential root causes and thus expediting the resolution process, Onepane contributes to lowering MTTR.
Incorporate OnePane into your IT operations strategy to experience the benefits of reduced MTTD and MTTR, and transform your incident management process into a well-oiled machine.