Observability
Get Started with Mimir - Part 1
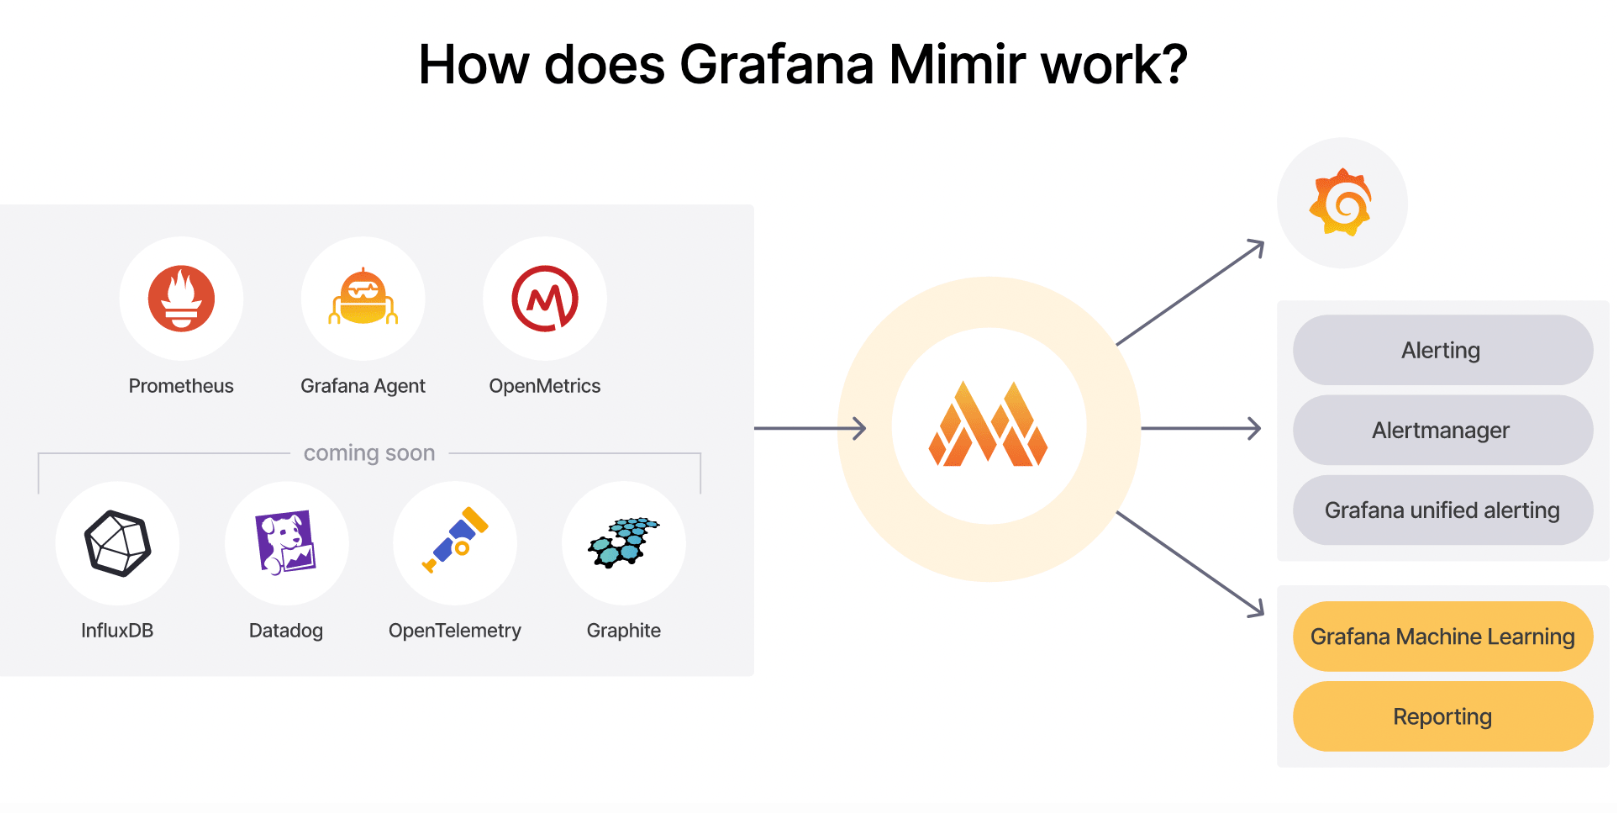
We have previously delved into numerous observability and monitoring stacks. Now, let's explore Grafana Mimir 😃 - its purpose, significance, and the scenarios in which we employ Grafana Mimir. What Grafana Mimir ? Grafana Mimir, introduced by Grafana Labs in 2022, is an open-source project designed with the primary goal
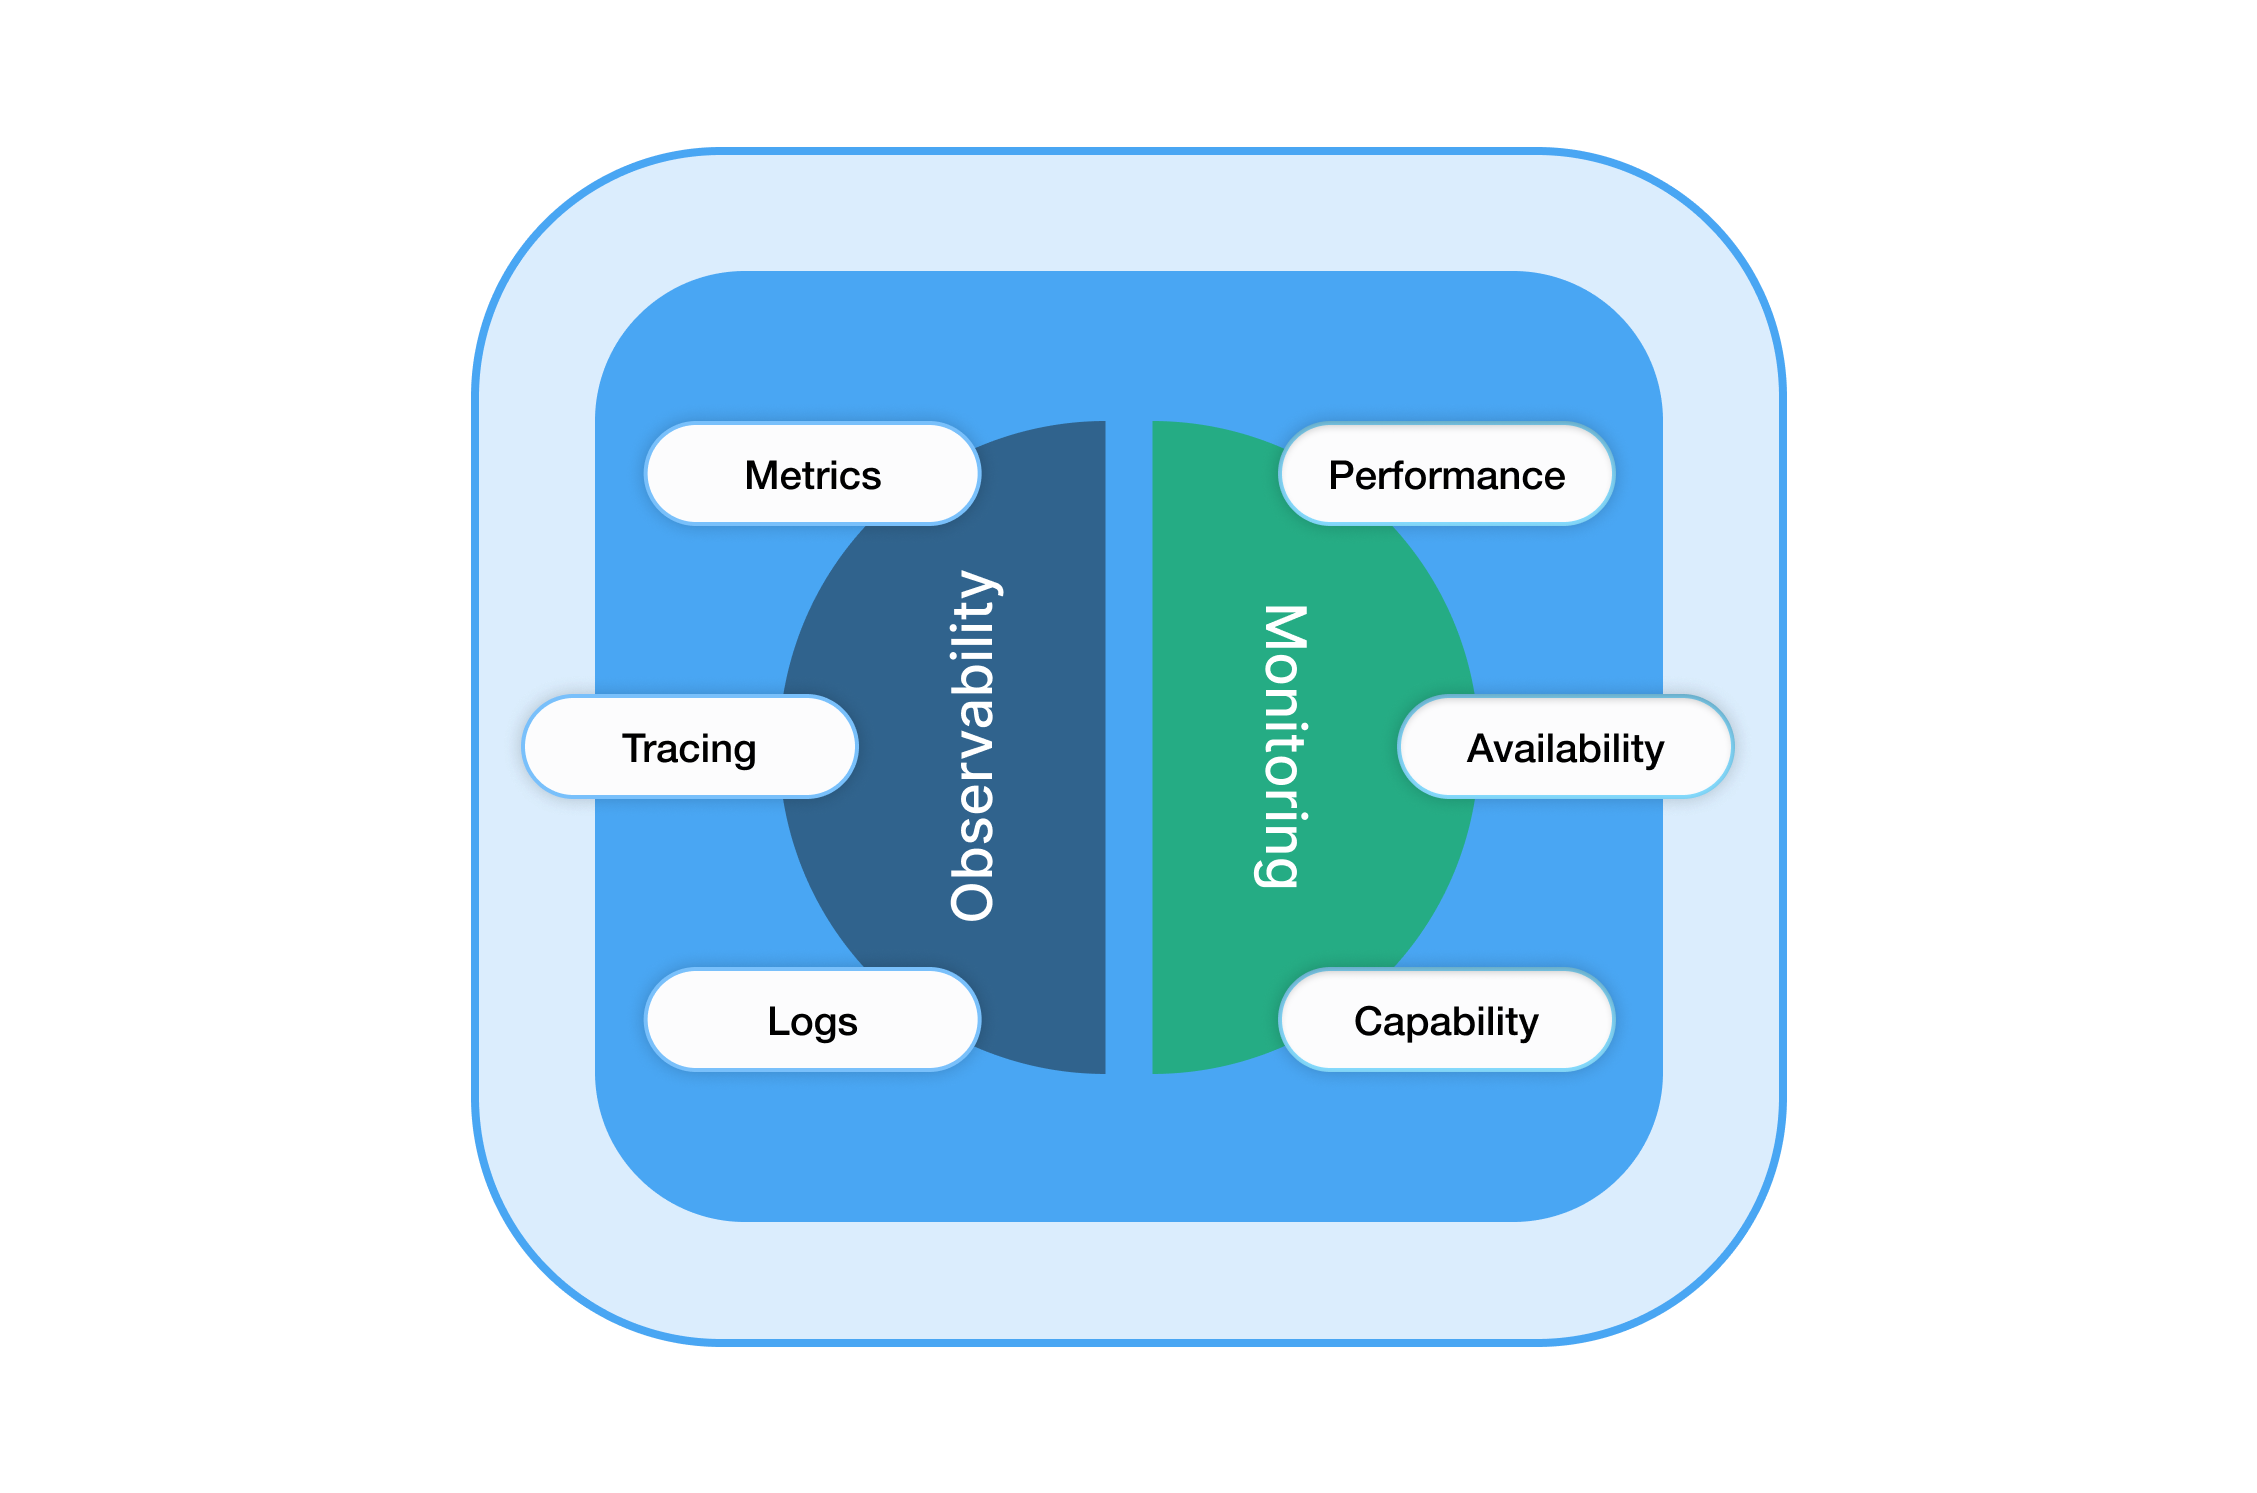
Observability VS Monitoring : Understanding the differences
Monitoring tracks trends and alerts, while Observability offers holistic insights. Together, they forge a crucial synergy for resilient applications
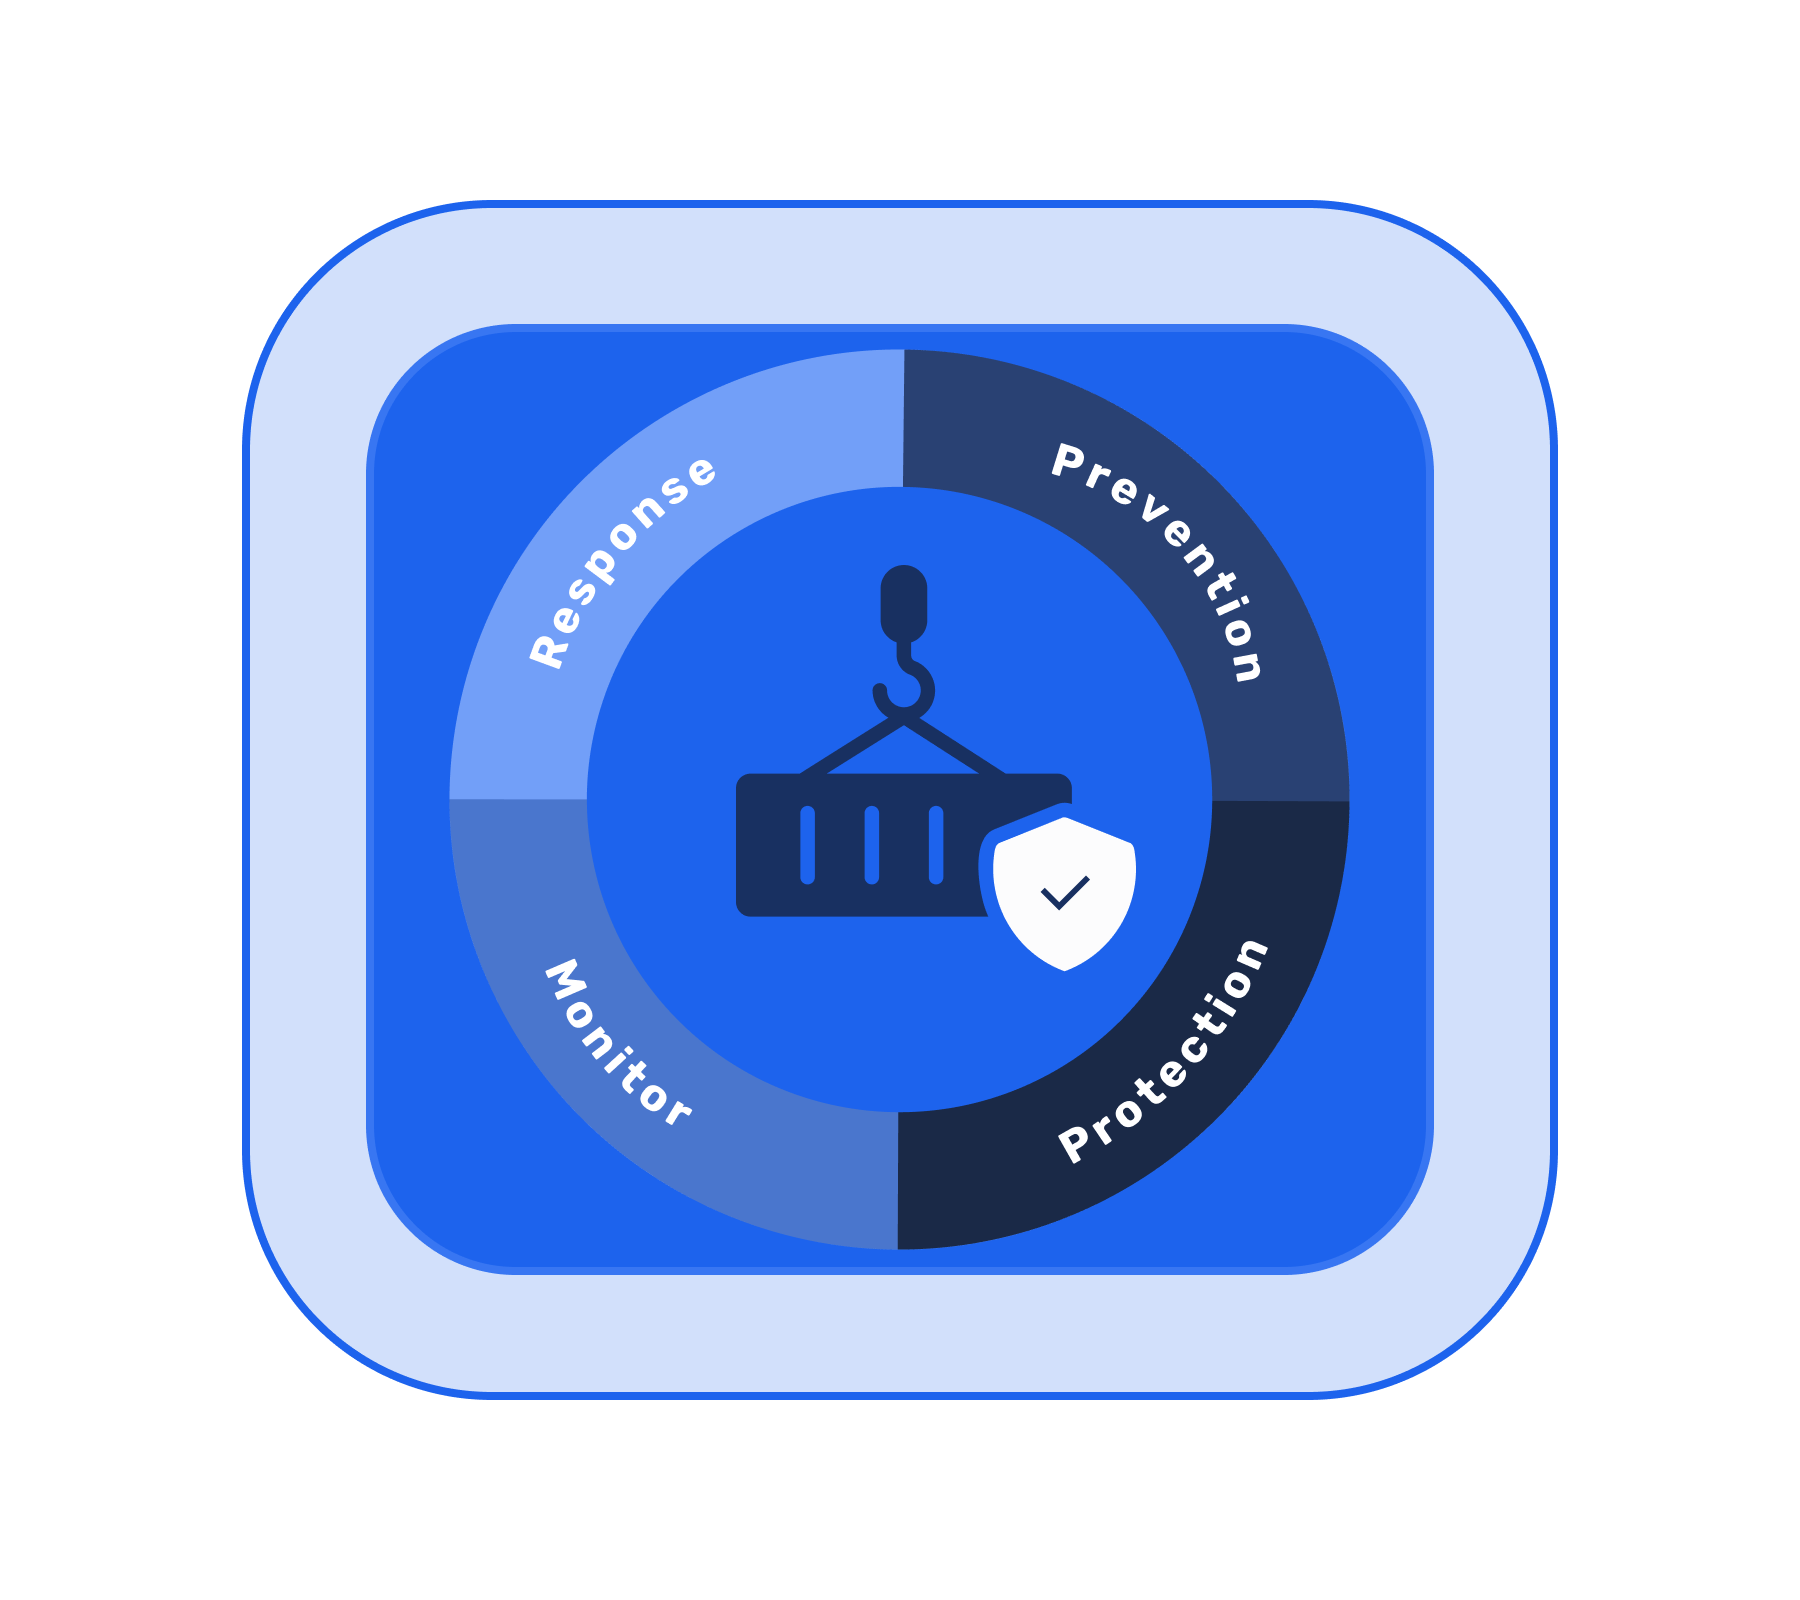
Getting started with Container Security Part 2: Build secure container images
Taking steps to harden your build environment is critical to maintaining good security for your containers.In this guide, we’ve covered some key steps you can take to create safer images and implement container security at build time.
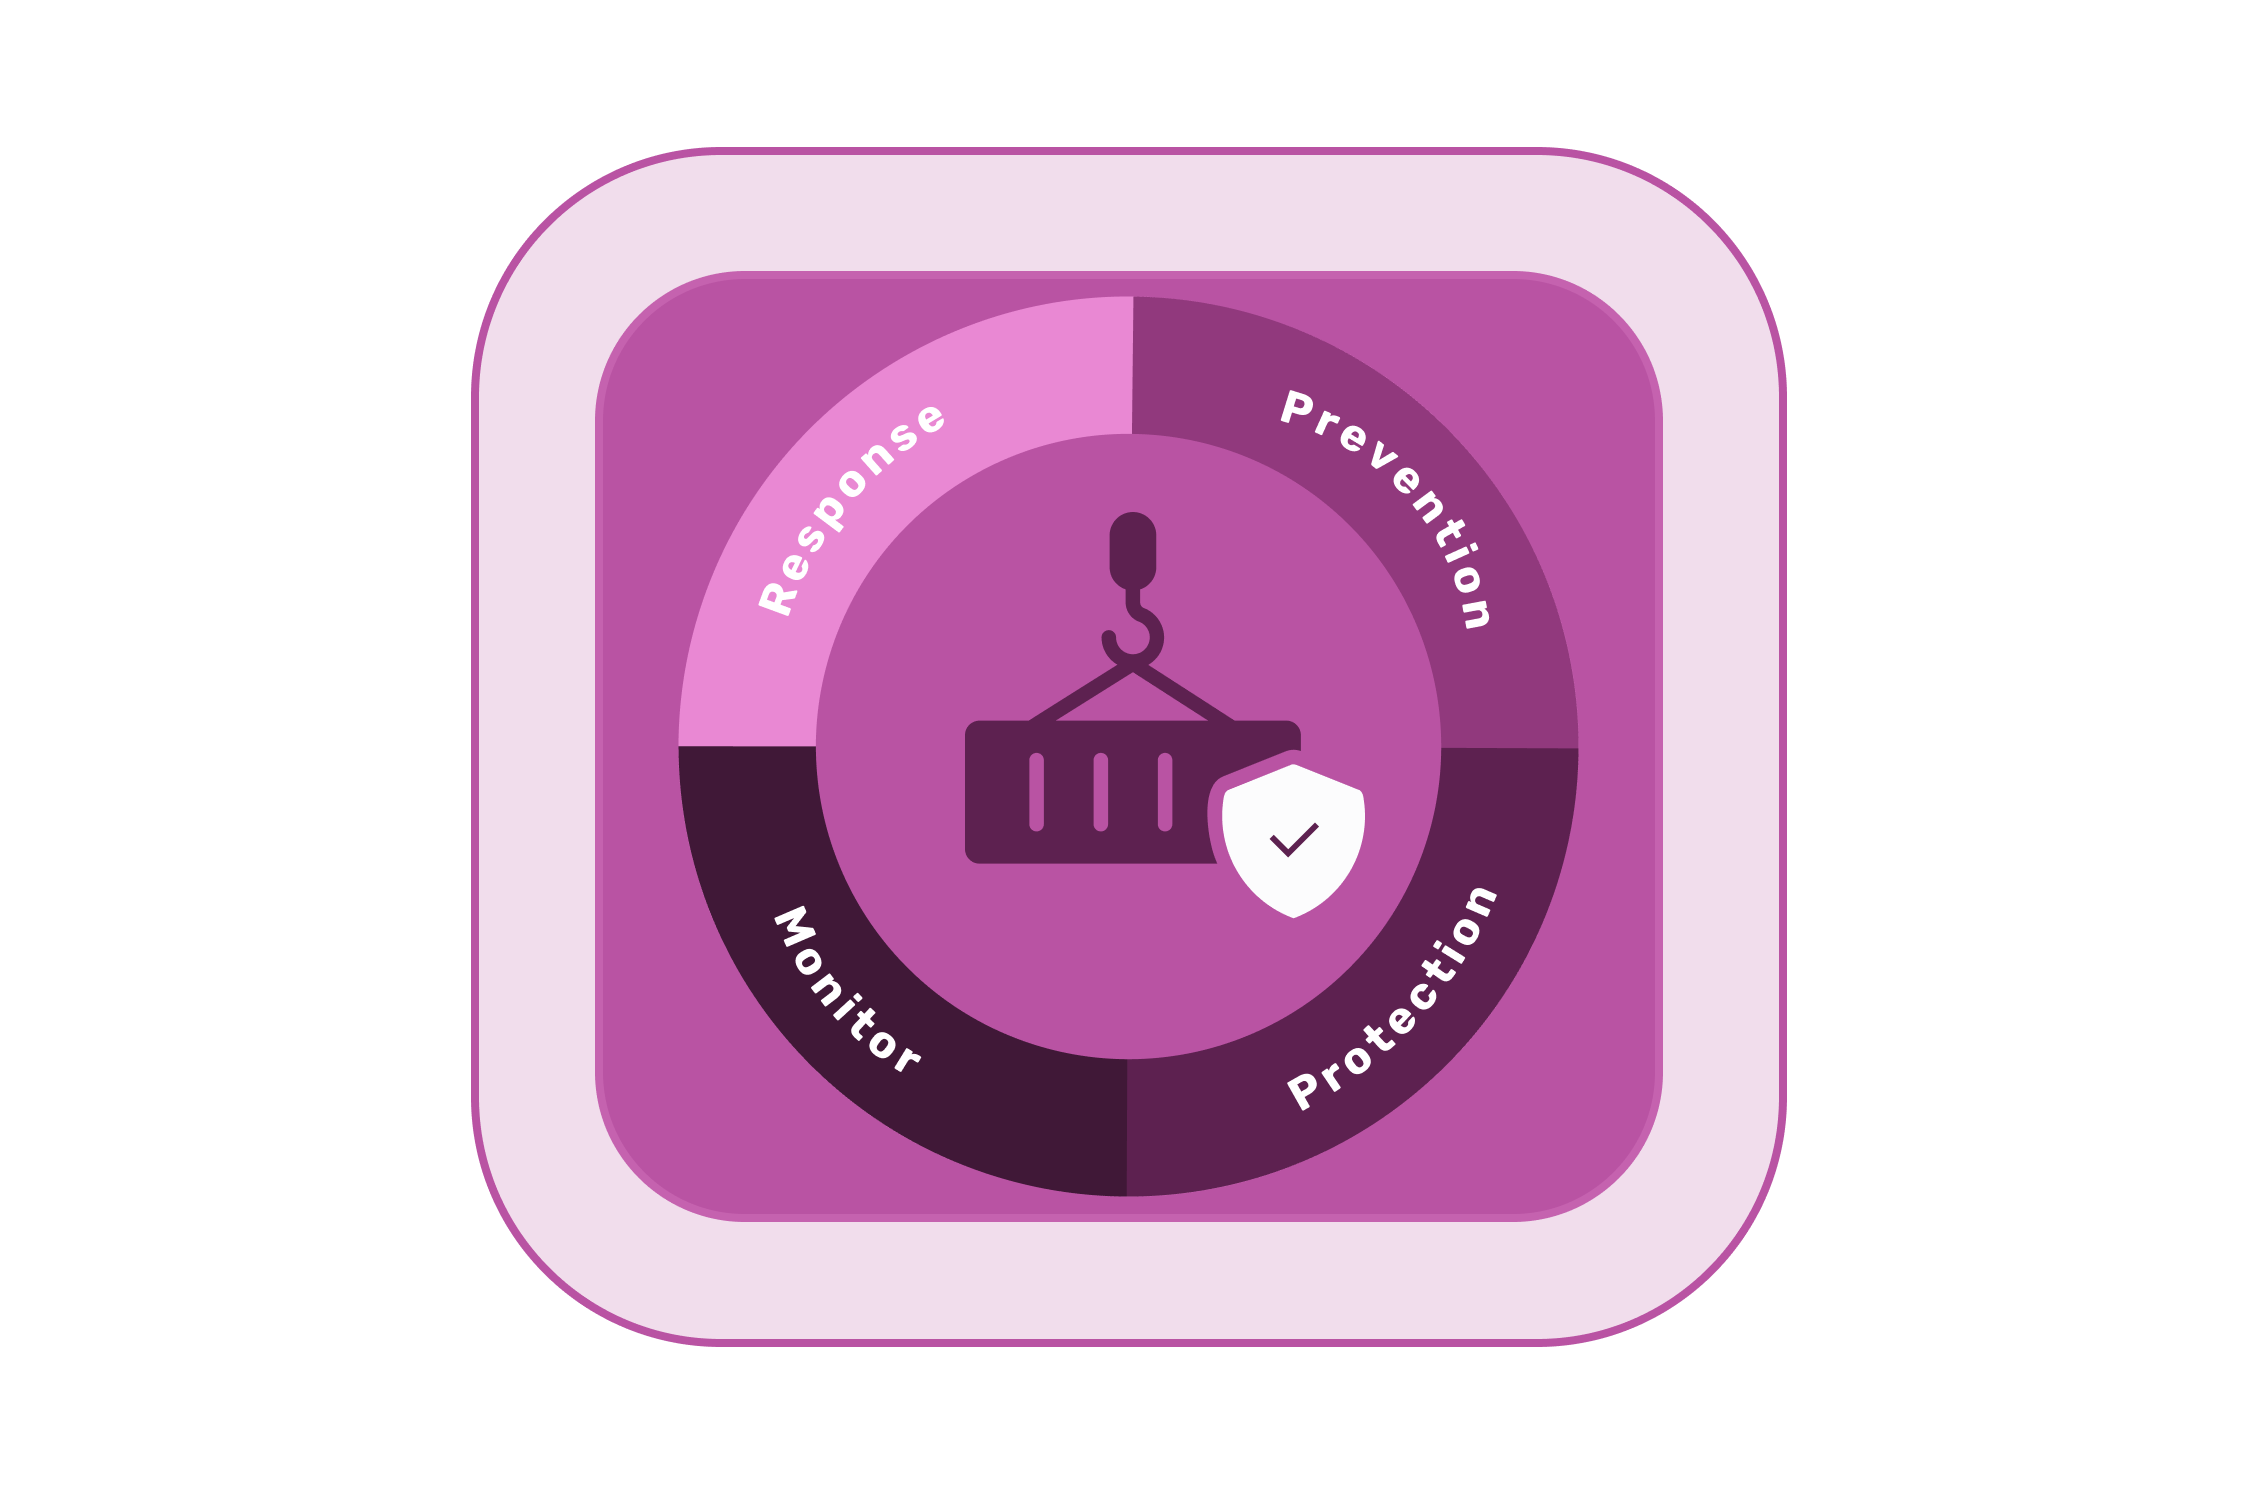
Getting started with Container Security Part 1 : Fundamentals of Container Security
Container security refers to the set of practices, technologies, and measures implemented to protect the entire lifecycle of containers, from their development and deployment to runtime and eventual decommissioning.
Getting started with LogQL Part 3: Aggregations
LogQL is a strong query language for analysing and aggregating log data. One of LogQL's important characteristics is its ability to conduct aggregations on log data, allowing users to efficiently summarise and examine enormous amounts of log entries.
Deploy Prometheus on Kubernetes using Helm
Prometheus doesn't have an inbuilt visualization capability so it will be using Grafana for visualization. This blog discusses how to deploy Prometheus with helm.